Observability
On this page
Level: Intermediate · Reading time: 11 min · Phase: 7 — Production AI
In one line: Observability means recording enough about each request (steps, time, tokens, cost, errors) that you can explain why the system behaved as it did.
Before you start: Monitoring and LangSmith. You should know that a dashboard shows numbers about a running system.
Explain it like I'm new
Think of a car dashboard plus a flight recorder. The dashboard shows speed and fuel now. The recorder lets you replay what happened after a problem.
There are three kinds of signals:
- Logs: timestamped text events ("guardrail blocked request 123").
- Metrics: numbers over time (requests per minute, error rate, p95 latency).
- Traces: the full story of one request, split into spans. A span is one timed step, such as "retrieve" or "llm_call".
Latency is how long something takes. p50 is the median: half of requests are faster. p95 means 95% are faster, so it shows the slow tail that users complain about. Averages hide that tail.
LLM apps add three things to watch on every request: tokens (the units a model reads and writes, which drive price), latency and cost.
Words to know:
- Span: one timed step inside a request, such as
retrieve. - Trace: all the spans of one request, nested together.
- p95: the latency that 95% of requests beat. It shows the slow tail.
- Request ID: a unique label passed to every step so you can join the logs.
- Token: a small piece of text a model reads or writes. Price is per token.
- Alert: an automatic message when a number crosses a limit.
Watch it
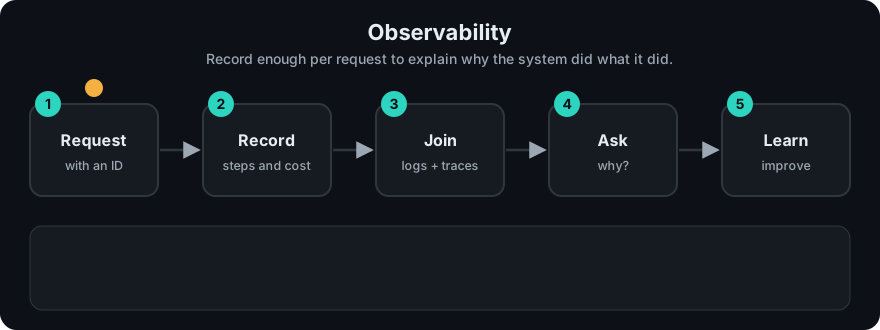
It plays on a loop. Read the caption in the box, one step at a time. Want to go at your own pace? Step through it with Previous and Next.
How it works
- Give each request a request ID and pass it through every step.
- Wrap each step (retrieval, rerank, LLM call, guardrail) in a span.
- On LLM spans, record input tokens, output tokens, model name, prompt version (topic 10) and computed cost.
- Record errors on the span.
- Aggregate: counts, error rate, p50/p95 latency, total tokens, total cost, cache hit rate.
- Alert on thresholds: error rate, p95 latency, daily spend.
- Log carefully: no secrets, redact PII (topics 11 and 12).
flowchart TD
  R[request span] --> RET[retrieve span]
  R --> G[guardrail span]
  R --> L[llm_call span: tokens, cost]
  R --> OUT[response]
  R --> TR[(Trace store)]
  TR --> D[Dashboard: p50/p95, cost, errors]
  D --> AL[Alerts]
Cost per call, with a tiny worked example (ILLUSTRATIVE prices of $0.001 per 1,000 input tokens and $0.002 per 1,000 output tokens):
500 input tokens  -> 500/1000 * 0.001 = 0.0005
100 output tokens -> 100/1000 * 0.002 = 0.0002
cost = 0.0007
Worked example
Why p95? Take ten requests with these latencies in milliseconds: 100, 110, 120, 130, 140, 150, 160, 170, 180, 2000. The average is 3160 / 10 = 316. The median (p50, the middle) is (140 + 150) / 2 = 145. Nine users waited under 200 ms, one waited two seconds. The average hides that user, and p95 sits in the slow tail near 2000, so it shows the problem.
Now the demo tracer. One request has a retrieve span and an llm_call span that records 500 input and 100 output tokens. Real output of the demo:
{'count': 1, 'errors': 0, 'p50_ms': 0.0021669839043170214, 'p95_ms': 0.0021669839043170214, 'input_tokens': 500, 'output_tokens': 100, 'total_cost': 0.0007}The p50_ms value differs on every run, because the demo step does nothing and takes microseconds. The rest is fixed: one call, no errors, 500 + 100 tokens, and cost 0.0007, which matches the hand calculation above.
Code example
prod_observability.py is a tiny stdlib tracer:
import sys
sys.path.insert(0, "07-production-ai/code")
from prod_observability import Tracer

t = Tracer()
with t.span("request"):
    with t.span("retrieve"):
        pass
    with t.span("llm_call", model="demo") as s:
        # ILLUSTRATIVE prices per 1,000 tokens
        s.record_usage(500, 100, price_in_per_1k=0.001, price_out_per_1k=0.002)

print(t.summary("llm_call"))
# {'count': 1, 'errors': 0, 'p50_ms': ..., 'p95_ms': ..., 'input_tokens': 500,
#  'output_tokens': 100, 'total_cost': 0.0007}
Spans nest through a stack, record errors if the block raises, and summary() returns counts, p50/p95, tokens and cost.
In real projects
Teams usually use OpenTelemetry for traces and metrics, Prometheus and Grafana for dashboards (topic 7), and an LLM-specific tool such as LangSmith (topic 8). Use logging with JSON output and include the request ID in every line. Check each tool's current docs for setup.
When to use it / when not to
- Add it before launch. You cannot debug a slow or wrong answer you did not record.
- Store prompt text only if policy allows. Otherwise store hashes and lengths.
- For a prototype, printing the summary is enough. Do not build dashboards before you have users.
Common mistakes
- Watching only average latency and missing the p95 tail.
- Not tracking tokens, so the first sign of a cost problem is the bill.
- Logging raw prompts with PII or keys.
- No request ID, so logs from one request cannot be joined.
- Dashboards but no alerts: nobody looks at the dashboard at 3 a.m.
Recap
If you remember only three things:
- Logs are events, metrics are numbers over time, and traces follow one request as timed spans.
- Use p95 latency, not the average, because the slow tail is what users notice.
- Record tokens, cost and a request ID on every LLM call, and redact sensitive data.
Interview questions
1. What is the difference between logs, metrics and traces? <details><summary>Answer</summary>Logs are event text, metrics are numbers over time, traces follow one request through its steps as spans.</details>
2. Why use p95 instead of the average? <details><summary>Answer</summary>A few slow requests barely move the average but hurt real users. p95 shows the slow tail.</details>
3. Which fields do you record on an LLM span? <details><summary>Answer</summary>Model, prompt version, input and output tokens, latency, cost, error, and request ID. Redact sensitive content.</details>
Go deeper
Prev: 12-guardrails.md · Next: 14-cost-optimization.md · Back to phase: Phase 7