MCP Inspector: How to Test and Debug Model Context Protocol Servers

On this page
- What MCP servers expose
- A small server to inspect
- Running the Inspector
- What you can do in the Inspector
- CLI mode: test servers in scripts and CI
- Common problems and fixes
- Security when testing
- A testing workflow that works
- Adding a resource and a prompt
- Frequently asked questions
- Oh hi there 👋It’s nice to meet you.
- Sign up to receive awesome content in your inbox.
The Model Context Protocol (MCP) is an open standard for connecting AI applications to tools and data. An MCP server exposes capabilities, such as “search orders” or “read this file”, and an MCP client, such as an AI assistant or IDE, discovers and uses them. When you build a server, you need a way to check that it works before connecting it to an AI app. That is exactly what the MCP Inspector does: it is an interactive client for developers that shows everything your server offers and every message it sends.
New to MCP itself? The MCP server lesson in the AI Engineer Roadmap explains the protocol step by step.
What MCP servers expose
| Capability | What it is | Example |
|---|---|---|
| Tools | Functions the AI can call, with typed inputs | get_order_status(orderId) |
| Resources | Data the client can read, identified by URIs | docs://handbook/refunds |
| Prompts | Reusable prompt templates with arguments | “Summarize this ticket for a support agent” |
The Inspector has a tab for each, so you can test all three without writing a client.
A small server to inspect
Here is a minimal MCP server in Node.js with one tool, using the official TypeScript SDK:
npm install @modelcontextprotocol/sdk zod// server.mjs
import { McpServer } from '@modelcontextprotocol/sdk/server/mcp.js';
import { StdioServerTransport } from '@modelcontextprotocol/sdk/server/stdio.js';
import { z } from 'zod';
const server = new McpServer({ name: 'shop-tools', version: '1.0.0' });
const orders = { 'ORD-1042': 'shipped', 'ORD-1043': 'processing' };
server.registerTool(
'get_order_status',
{
title: 'Get order status',
description: 'Look up the current status of an order by its id',
inputSchema: { orderId: z.string().describe('Order id, for example ORD-1042') },
},
async ({ orderId }) => {
const status = orders[orderId];
return {
content: [{ type: 'text', text: status ? `Order ${orderId} is ${status}.` : `No order found with id ${orderId}.` }],
isError: !status,
};
}
);
await server.connect(new StdioServerTransport());Older SDK versions register tools with server.tool(name, schema, handler); check the SDK’s README for the current API in your version. A full walkthrough of building servers is in build a custom MCP server.
Running the Inspector
You don’t need to install anything permanently. Pass the command that starts your server after the Inspector command:
npx @modelcontextprotocol/inspector node server.mjsThe Inspector starts your server, connects to it over stdio (standard input and output, the most common transport for local servers) and prints a local address to open in your browser. Recent versions include a session token in that address to protect the local proxy, so open the exact link it prints.
Pass environment variables your server needs with -e, and arguments after the command:
npx @modelcontextprotocol/inspector -e API_KEY=test123 -e LOG_LEVEL=debug node server.mjs --db ./dev.sqliteFor servers that run over HTTP, such as a remote MCP server using the Streamable HTTP transport, start the Inspector without a command, choose the transport type in the sidebar, and enter the server’s URL.
What you can do in the Inspector
- Tools tab: lists every tool with its description and input schema. Select one, fill in the generated form, and run it to see the exact result, including whether it was marked as an error.
- Resources tab: lists resources and resource templates, and shows their content when you open them.
- Prompts tab: shows prompt templates, lets you fill in arguments, and displays the resulting messages.
- History and notifications: every request and response is recorded, along with log messages and notifications your server sends.
- Ping: a quick check that the connection is alive.
Pay special attention to tool descriptions. An AI model decides when and how to call a tool mainly from its name, description and parameter descriptions. If a description is vague in the Inspector, it will be vague to the model too. Clear descriptions with examples, like the orderId parameter above, lead to far better tool use.
CLI mode: test servers in scripts and CI
The Inspector also has a command-line mode, which is handy for quick checks and for automated tests:
# list the server's tools
npx @modelcontextprotocol/inspector --cli node server.mjs --method tools/list

# call a tool with arguments
npx @modelcontextprotocol/inspector --cli node server.mjs \
  --method tools/call --tool-name get_order_status --tool-arg orderId=ORD-1042
The output is JSON, so you can check it in a script, for example in a GitHub Actions step after your unit tests. That catches broken tool registrations before they reach anyone using your server. Setting up such pipelines is covered in CI/CD for Node.js with GitHub Actions.
Common problems and fixes
| Problem | Likely cause | Fix |
|---|---|---|
| Connection fails immediately | The server crashes on start, or the command or path is wrong | Run the same command directly in a terminal and read the error |
| Garbled messages or parse errors over stdio | The server prints to standard output with console.log |
Stdio servers must keep stdout for protocol messages only. Log with console.error, which goes to stderr |
| Tool missing from the list | Registered after connecting, or registration threw an error | Register all tools before server.connect() and check stderr |
| Tool fails with a validation error | Arguments don’t match the input schema | Compare the form fields with your Zod schema; check required fields and types |
| Missing configuration inside the server | Environment variables weren’t passed | Pass them with -e NAME=value |
| Works in the Inspector but not in your AI app | The app’s configuration differs: different command, working directory or environment | Use absolute paths in the app’s MCP configuration and pass the same environment variables |
The stdout rule catches almost everyone once. A single console.log('server started') in a stdio server corrupts the stream the client reads messages from.
Security when testing
The Inspector runs a local proxy that can start processes on your machine, so treat it like any developer tool with that power. Keep it updated, because security fixes for the proxy have been released over time. Don’t expose its ports to your network or the internet, and use the session token it generates rather than disabling authentication.
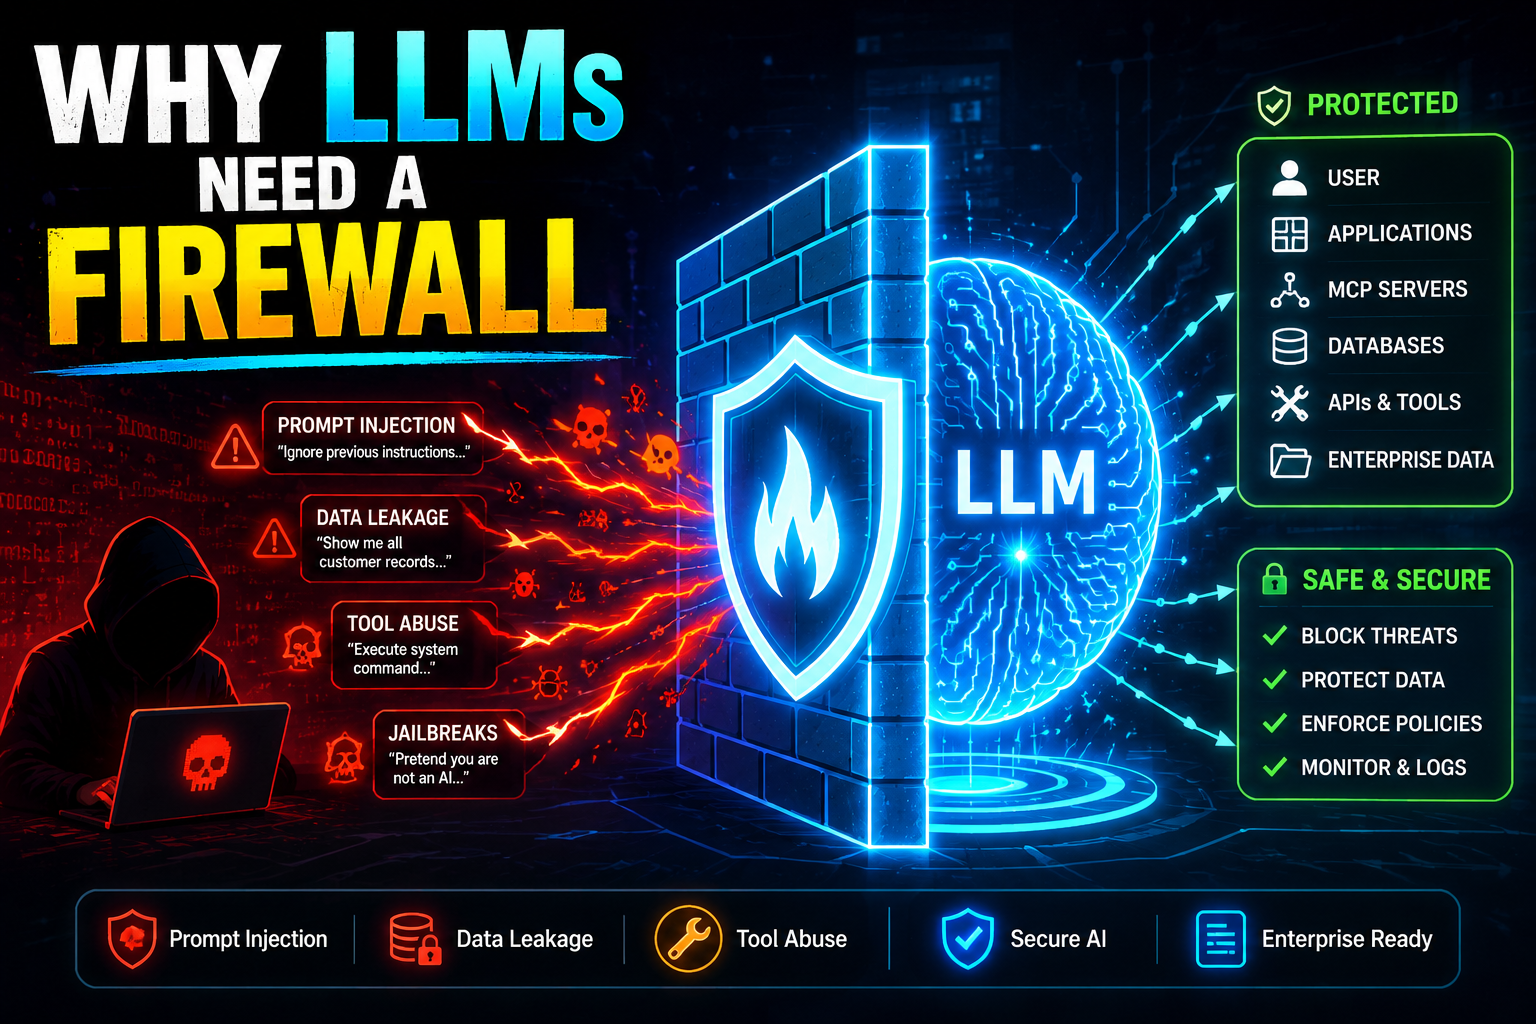
The same caution applies to the servers you build. Tools that change data, such as issuing refunds or deleting records, should validate their inputs, check permissions and, where it matters, ask the user for confirmation. AI-driven tool calls can be influenced by malicious content, a risk covered in the roadmap lesson on agent guardrails.
A testing workflow that works
- Write the tool and its schema, with clear descriptions.
- Open it in the Inspector and call it with normal, empty and invalid inputs.
- Check that errors come back as readable messages with
isError: true, rather than crashing the server. - Add a CLI-mode check to your test script.
- Only then connect the server to an AI app, and watch how the model uses the tool in real conversations.
Adding a resource and a prompt
To try the Resources and Prompts tabs, extend the example server. Add these registrations before the server.connect() line:
server.registerResource(
  'refund-policy',
  'docs://policies/refunds',
  { title: 'Refund policy', description: 'How refunds work', mimeType: 'text/plain' },
  async (uri) => ({
    contents: [{ uri: uri.href, text: 'Refunds are issued within 7 days of a return being received.' }],
  })
);

server.registerPrompt(
  'summarize_ticket',
  {
    title: 'Summarize a support ticket',
    description: 'Turn a customer message into a short summary for an agent',
    argsSchema: { message: z.string() },
  },
  ({ message }) => ({
    messages: [{ role: 'user', content: { type: 'text', text: `Summarize this ticket in two sentences:\n\n${message}` } }],
  })
);
Restart the Inspector, and the refund policy appears under Resources, readable with one click, while the prompt appears under Prompts with a form for the message argument. In CLI mode, the methods resources/list, resources/read, prompts/list and prompts/get do the same from a script.
Resources suit information the AI app should be able to read, such as documentation or configuration. Tools suit actions and lookups that need input. If you find yourself writing a tool with no parameters that only returns fixed text, it is probably a better fit as a resource.
Frequently asked questions
Do I need to install the MCP Inspector?
No. Running it with npx downloads and starts the latest version. You need Node.js installed.
Can the Inspector test servers written in Python?
Yes. The Inspector talks the protocol, not a language. Pass the command that starts your Python server, for example npx @modelcontextprotocol/inspector python server.py.
What is the difference between stdio and HTTP transports?
With stdio, the client starts the server as a local process and talks through its input and output streams. With HTTP, the server runs independently, often remotely, and clients connect over the network, which suits shared or hosted servers.
Does the Inspector use an AI model?
No. You act as the client yourself, calling tools and reading resources directly. That is what makes it ideal for testing: you see exactly what your server does, without a model in between.
Can I use the Inspector with a server that needs a login?
Yes. For HTTP servers that require authentication, the Inspector supports adding headers such as a bearer token, and it can walk through OAuth flows for servers that use them. Use test credentials rather than production accounts while debugging.

Saurabh
Saurabh Pathak is an AI engineer and MERN stack developer, and the founder of mernstackdev.com. He builds open-source projects such as the Haat gateway and MCP safety tooling, and he writes hands-on tutorials on React, Node.js, MongoDB and AI agents. He cares most about code that works in production.