Evaluating Generative Models and Benchmarks
In short: To trust a model score you need the right metric (pass@k for code), an error bar, and proof that the test questions were not in the training data.
On this page
Level: Advanced · Reading time: 10 min · Phase: 10 · Frontier AI Engineering
Before you start: RAG Evaluation and LLM as a Judge.
Explain it like I'm new
A leaderboard says Model A scores 72 and Model B scores 70. Is A better? Three questions decide it. How many questions were asked (50 questions gives a wide error bar)? Could the model have seen the answers during training (contamination)? And is the score measuring what your users need?
This lesson gives you three tools: pass@k for code-style tasks, a bootstrap confidence interval for any 0-or-1 score, and an n-gram overlap check for contamination.
Watch it
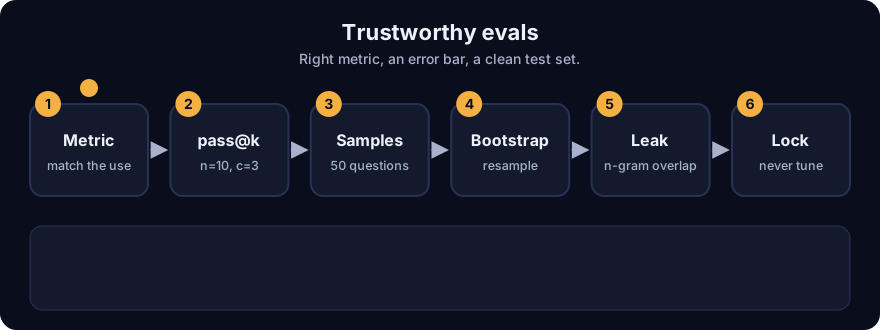
It plays on a loop. Read the caption in the box, one step at a time. Want to go at your own pace? Step through it with Previous and Next.
How it works
1. Metrics by task
| Task | Typical metric | Watch out for |
|---|---|---|
| Multiple choice | Accuracy | Guessing rate, answer-position bias |
| Code | pass@k with unit tests | Weak tests, contamination |
| Maths with a final number | Exact match | Format mismatch ("5" vs "5.0") |
| Summaries and chat | Rubric scores by humans or a judge model | Judge bias towards length and its own style |
| Retrieval | recall@k, MRR | Labels that are incomplete |
2. pass@k
Generate n samples per problem and run the tests. If c pass, the unbiased estimate of "at least one of k samples passes" is (Chen et al., 2021):
pass@k = 1 − C(n − c, k) / C(n, k)From the demo, n = 10 samples with c = 3 correct:
| k | pass@k |
|---|---|
| 1 | 0.3000 |
| 3 | 0.7083 |
| 5 | 0.9167 |
| 10 | 1.0000 |
Check by hand for k = 3: 1 − C(7,3)/C(10,3) = 1 − 35/120 = 0.7083. pass@1 is just c / n.
Pick k to match how the product works: pass@1 if users get one answer, pass@5 if the tool shows five candidates or runs tests before replying.
3. Error bars: a bootstrap
A score from 50 questions is noisy. A bootstrap resamples the question results with replacement many times and looks at the spread of the average. The demo scores 36 correct of 50 (72 percent) and gets a 95 percent interval of about 0.58 to 0.84. A rival scoring 70 percent is inside that range, so you cannot say A beats B. More questions narrow the interval, and so does comparing both models on the same questions (a paired comparison).
4. Contamination
If benchmark questions leaked into training data, the model has memorised answers and the score overstates ability. A quick check compares word n-grams (here 5-word sequences). In the demo, a test question and a blog post that quotes most of it share 0.8 of the question's 5-grams. Common practice: flag items above a threshold, report scores with and without them, and prefer fresh or private test sets you wrote yourself.
5. LLM-as-judge, carefully
A strong model scoring answers is fast and cheap but biased: it prefers longer answers, its own style and the first option shown. Mitigate by swapping answer order, using a written rubric, calibrating against a human-labelled sample, and reporting agreement with humans. See LLM as a Judge.
6. Build your own eval, small and honest
- Collect 100 real prompts from your product, with the outcome you want.
- Split into a dev set (tune prompts on it) and a locked test set (look once).
- Score with the cheapest reliable method: exact match, tests, or a rubric.
- Report a mean with an interval, never a single number.
- Add every production failure back into the set, and refresh the locked part so it cannot be overfit.
Worked example
From real output of fa_evals.py.
- A model writes 10 solutions to a coding task. Three pass the tests.
- pass@1 = 0.30, pass@3 = 0.7083, pass@5 = 0.9167. The more tries the product allows, the better it looks.
- A separate run scores 36 of 50 on a quiz: 72 percent, interval 0.58 to 0.84. A rival at 70 percent is not meaningfully behind.
- A test question shares 80 percent of its 5-grams with a blog post. Treat that item as contaminated.
Code example
from math import comb

def pass_at_k(n, c, k):
    if n - c < k:
        return 1.0
    return 1.0 - comb(n - c, k) / comb(n, k)

print(round(pass_at_k(10, 3, 1), 4))   # 0.3
print(round(pass_at_k(10, 3, 3), 4))   # 0.7083
Run python 12-frontier-ai/code/fa_evals.py; tests: pytest 12-frontier-ai/code/test_fa_evals.py.
In real projects you use an eval framework to run prompts and score them, but the three ideas stay the same: the right metric, an interval, and a clean test set.
Common mistakes
- Comparing two models on 30 questions and declaring a winner from a 2-point gap.
- Computing pass@k by taking only k samples once. The estimator above uses n larger than k and is unbiased.
- Tuning prompts on the test set until the score looks good.
- Trusting a public benchmark without asking if its questions were in the training data.
- Letting a judge model grade answers without checking its agreement with humans.
Recap
If you remember only three things:
- Pick the metric that matches how the product uses the model. For code, pass@k with real tests.
- Report an interval, not a single number. 72 percent on 50 questions is really 58 to 84 percent.
- Check for contamination, and keep a locked test set you never tune on.
Interview questions
1. Explain pass@k and when pass@1 is more appropriate than pass@5. <details><summary>Answer</summary> pass@k is the probability that at least one of k samples passes the tests, estimated as 1 − C(n−c, k)/C(n, k) from n samples with c passing. Use pass@1 when the user gets a single answer; pass@5 only if the product really shows or tests five candidates. </details>
2. Model A scores 72 percent and Model B 70 percent on 50 questions. What do you conclude? <details><summary>Answer</summary> Nothing yet. A 95 percent bootstrap interval for 72 percent on 50 questions is roughly 58 to 84, which easily contains 70. You need more questions or a paired comparison on the same items before claiming a difference. </details>
3. How do you detect and handle benchmark contamination? <details><summary>Answer</summary> Compare n-gram overlap between test items and training text, flag high-overlap items, report results with and without them, and prefer private or newly written test sets. Also keep your own evaluation data out of any synthetic data or tuning sets. </details>
Go deeper
- Evaluating Large Language Models Trained on Code (Chen et al., 2021)
- Judging LLM-as-a-Judge with MT-Bench (Zheng et al., 2023)
- An Introduction to the Bootstrap (Efron and Tibshirani)
Prev: Distillation and Synthetic Data · Next: Back to the roadmap · Back to phase: Phase 10